Crypto Tokenomics for Teens
Cryptocurrency can be exciting, but all the numbers and jargon can feel overwhelming for new investors. Many newcomers focus only on a coin’s price, but that number doesn’t mean much on its own. A $100 coin isn’t automatically “better” than a $1 coin. It simply depends on how many coins exist and other factors.
This is where tokenomics comes in. Tokenomics refers to the key metrics that affect a crypto token’s value, like how many coins are out there, how much money is invested in it, how actively it’s traded, and how its supply can grow. By understanding these fundamentals, you can see through the hype and make smarter decisions. In this article, we’ll break down core token valuation metrics teen investors should know: market cap, fully diluted valuation (FDV), trading volume, volume/market cap ratio, circulating vs. total vs. max supply, and token inflation.
All of this information can be found at a popular crypto website, www.coinmarketcap.com. (Here is a good video on how to navigate the Coinmarketcap website: https://youtu.be/l65M98Vaa5I?si=0JJ_-CQh46wrPypb).
Exhibit 1 below is an example of the kind of information you can find on the site when you enter BTC (for Bitcoin) in the dialog box of the site’s landing page for Bitcoin (as of July 9, 2025).
Exhibit 1
In this article, I’ll use five real examples (Bitcoin, Dogecoin, Worldcoin, Internet Computer, and XRP) to show how these metrics work and why wild price predictions on social media often don’t add up. Please note that no matter the date of the snapshots used in this article, the principles I am trying to illustrate are still relevant at any time for teen investors who want to learn about cryptos.
Market Capitalization: Measuring a Cryptocurrency’s Size
One of the most important numbers is the market capitalization (market cap). Market cap is basically the total value of all the coins currently in circulation. In simple terms, it’s calculated by multiplying a coin’s price by its circulating supply. This tells you how much value the market assigns to the whole project at the moment. For example, if a coin is worth $5 each and there are 100 million of them circulating, the market cap is $5 × 100,000,000 = $500 million. A higher market cap means the crypto is “bigger” or more valuable in aggregate. It’s similar to how we compare companies by the total value of their shares.
It’s important for young investors to understand that price per coin alone can be misleading. A coin with a low price (pennies or dollars) can still have a huge market cap if billions of those coins exist.
On the other hand, a coin with a high price can have a modest market cap if supply is small. For instance, Bitcoin trades at tens of thousands of dollars per BTC, giving it a massive market cap (over $2.3 trillion in July 2025) because about 19.88 million BTC are circulating as shown in Exhibit 1.
Meanwhile, Dogecoin trades at around 17 cents, but with 150+ billion DOGE in circulation its market cap is around $26.1 billion (as shown in Exhibit 2).
Don’t let a cheap price tag fool you – always check the market cap to see the true scale of a crypto project. Generally, the top coins by market cap (like Bitcoin) are more established, whereas newer or niche tokens have smaller market caps.
Exhibit 2
Market cap only counts the coins that are actively circulating, not those that might be locked up or not yet released. This means two projects can have the same current market cap, but if one has a lot more tokens coming in the future, its potential value might be very different. This is where the idea of Fully Diluted Valuation comes in, which I will discuss later in this article.
Circulating Supply vs. Total Supply vs. Max Supply
To understand market cap and a token’s value, you need to know how many coins exist. Crypto projects report three supply numbers: circulating supply, total supply, and max supply. It’s easy to mix them up, so let’s define each:
Circulating Supply
Circulating supply is the number of coins that are currently available to the public and trading in the market. It’s like the money actually floating around in the economy that people can use. It does not include coins that are locked, reserved by the team, or otherwise not on the market. You can think of it like the cash in circulation versus cash sitting in a bank vault. For example, Bitcoin has a fixed max supply of 21 million, but as of mid-2025 about 19.7–19.9 million BTC are in circulation (See Exhibit 1). The remainder are either yet to be mined or lost (inaccessible in forgotten wallets). Circulating supply is the figure used to calculate market cap, because it reflects the coins actually in public hands.
Total Supply
Total supply is the total number of coins that exist right now, including the circulating supply plus any coins that are locked up or not yet available to the public. It excludes any coins that have been permanently destroyed (burned). In other words, total supply = circulating supply + locked/vested coins (minus burned coins). Total supply gives you an idea of how many coins have been created in total so far, even if not all are on the market. If a project has a much higher total supply than circulating, it means a lot of coins are being held back that could come into circulation later (which could affect the price).
Max Supply
Max supply is the maximum number of coins that can ever exist over the life of the project. Not all cryptocurrencies have a max supply, but those that do (like Bitcoin) have a hard cap encoded in their rules. Max supply is like the ceiling for how many coins there will ever be. For Bitcoin, the max supply is 21,000,000 BTC – no more can ever be created once that many have been mined. Dogecoin, on the other hand, has no maximum supply (as shown in Exhibit 2) – it’s designed to keep producing new coins indefinitely (making it what’s called an inflationary currency). Some projects set a high max supply but only issue tokens gradually.
Understanding Supply Metrics
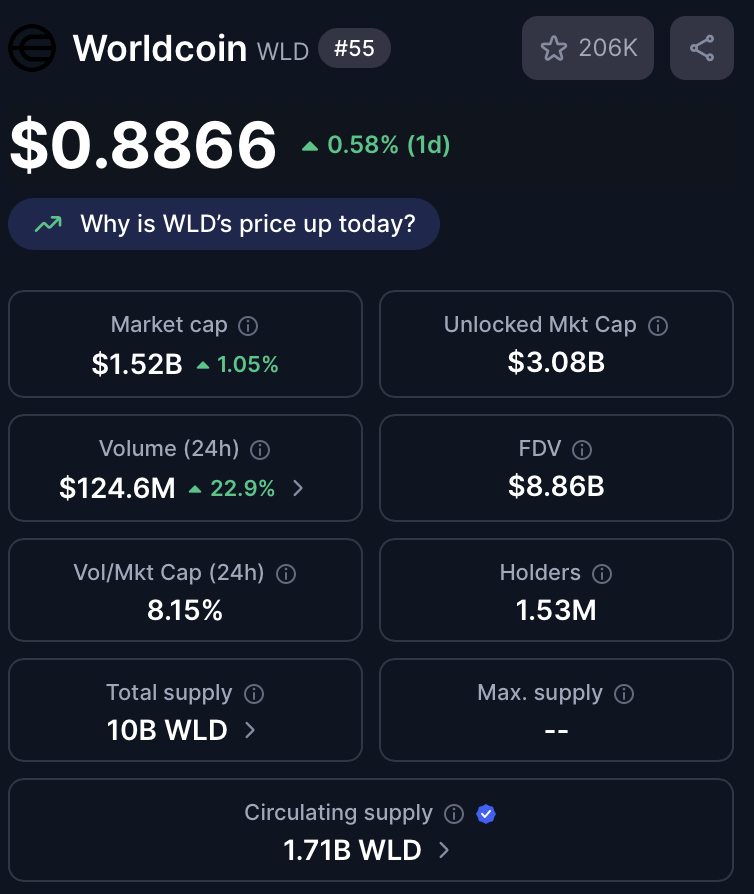
Understanding these supply metrics helps you evaluate scarcity. A coin with a low circulating supply but a very high total or max supply could face a lot of dilution as more coins enter the market. By contrast, a coin near its max supply (or with no new coins being added) is scarcer. This scarcity can support its value if demand stays strong. Always check how much of the total supply is already circulating. For example, Worldcoin (WLD) has a total supply of 10 billion tokens, but only about 1.71 billion was circulating at the time of this writing (as shown in Exhibit 3) – that’s roughly only 17% of its total supply.
Exhibit 3
This means 83% of WLD tokens are not on the market yet, which is a huge amount still to come. In contrast, Bitcoin’s circulating supply in 2025 is about 94% of its max supply (19.88M out of 21M), meaning it’s very close to fully issued, and new supply is added very slowly.
Dogecoin has all of its current supply (around 150 billion DOGE) in circulation, but because it has no cap it keeps increasing by 5 billion DOGE per year.
Internet Computer (ICP) had about 535 million ICP in circulation (which was essentially its total supply at the time), and like Dogecoin it does not have a fixed max supply (meaning that it’s inflationary). The bottom line: how many coins exist now, and how many will exist in the future, strongly influences a token’s value. A scarce supply (if demand is high) tends to support higher prices, while a flood of new coins can push prices down if demand doesn’t keep up. ICP information is shown in Exhibit 4.
Exhibit 4
Fully Diluted Valuation (FDV): Future Market Cap if All Coins Were Out
When a coin’s circulating supply is much lower than its total or max supply, it’s useful to look at the Fully Diluted Valuation (FDV). FDV estimates the cryptocurrency’s market cap if all possible tokens were in circulation. In other words, it answers the question: What would this project be worth at today’s prices if it had 100% of its coins released? The FDV is calculated by multiplying the current price by the total (or max) supply of the token. More can be found on fully diluted value on the Coinbase website: FDV.
For example, let’s say a new token is priced at $0.50 and there are 100 million tokens in circulation, so the current market cap is $50 million. But suppose the project plans to eventually have 1 billion tokens in total. If the price stayed $0.50 and all 1 billion were out, the market cap would be $0.50 × 1,000,000,000 = $500 million. That $500 million is the FDV. It’s basically the current price * the maximum supply. FDV gives you a sense of the project’s potential scale and whether the current price might be overvalued once future supply is considered.
Meaning of the Gap Between FDV and Market Cap
A big gap between FDV and current market cap means a lot of dilution is coming. Worldcoin (WLD) is a good example: its market cap as of July 2025 was about $1.5 billion, but its FDV (if all 10 billion tokens were out) was about $8.86 billion (as shown in Exhibit 2). That means investors are eventually facing a much larger supply – the project’s fully-realized value is several times the current value. If the project can’t grow its overall demand or usage by the time those tokens unlock, the price per token could drop because of the increased supply.
On the other hand, Bitcoin’s FDV is only slightly higher than its market cap (around $2.30 trillion vs. $2.17 trillion), since nearly all BTC that will ever exist are already circulating. This makes Bitcoin’s price less likely to be diluted by new supply (its supply growth is minimal). Always check FDV for newer projects – it helps you avoid thinking a coin is “cheap” just because the current market cap is low. If FDV is dramatically higher, that coin’s valuation may balloon in the future or its price may need to adjust downward unless demand grows accordingly. In short, market cap shows what a project is worth now, while FDV shows what it could be worthif all tokens were out[16]. Savvy investors use FDV to gauge long-term dilution risk.
24h Trading Volume and Volume/Market Cap Ratio
24-Hour Trading Volume
Another key metric is the 24-hour trading volume, often just called volume. This tells you how much of the cryptocurrency (in dollar terms) was traded in the last 24 hours across multipole exchanges (including Coinbase and Binance). Volume basically measures market activity and liquidity – how many people are buying or selling and how much money is flowing through the coin each day. A high trading volume means a lot of interest and that you can likely buy or sell the coin easily without huge price swings. Low volume means the coin isn’t being traded much, which could make it harder to sell or more prone to price volatility.
For instance, Bitcoin in July 2025 had around $45 billion in 24h volume, reflecting its huge worldwide trading interest and liquidity. In comparison, Dogecoin had about $986 million traded in 24h, and Worldcoin around $125 million. These are smaller volumes, but still significant – they show active communities trading those coins daily. If you see a coin with very low volume relative to its market cap, it might mean most holders are just holding and not many new buyers, or that the coin isn’t widely traded on big exchanges.
Volume to Market Cap Ratio
A helpful derived metric is the Volume/Market Cap ratio, usually given as a percentage. This ratio tells you what fraction of the coin’s market cap was traded in the last day. It’s calculated as (24h volume ÷ market cap) × 100%. For example, if a coin has a $1 billion market cap and $100 million was traded today, the Volume/Mcap ratio is 10%. This gives a sense of how actively traded a coin is relative to its size.
A higher ratio means a lot of turnover. A high turnover ratio reflects that the coin’s ownership is “changing hands” frequently, which is an indication of strong interest or momentum.
A low turnover ratio means the coin is relatively dormant (only a small portion of its value is trading each day), which might suggest many investors are holding long-term or there’s just not much attention on it at the moment.
For our examples: Worldcoin (WLD) had a volume/mcap around 8.1% (which is quite high) – over 8% of its value traded in one day, indicating active speculation since it’s a newer project (see Exhibit 3).
Dogecoin’s volume/mcap was about 3.8% (Exhibit 4), and Bitcoin’s was around 2%. (Exhibit 1). Bitcoin’s ratio is lower in part because its market cap is so huge (over $2 trillion) that even $45B volume is a small percent; many BTC holders just hold it long-term, so not all coins move frequently. An unusually high volume/mcap (for example, over 100%) can happen during a frenzy when a coin’s entire market cap worth of value trades in a day – this often means very high excitement or volatility. Generally, a healthy volume/mcap ratio in the single or low double digits indicates a coin has good liquidity. Use this ratio to gauge market interest: if a coin’s ratio is extremely low (say <1%), it might be a sleeping giant or just a dead coin with few buyers/sellers; if it’s extremely high, the coin could be experiencing hype or even manipulation if volume seems out of whack for its size. As a teen investor, you want to see some steady volume – it shows the coin has an active market.
Token Inflation and Why It Matters
Token inflation refers to the increase in a cryptocurrency’s supply over time. Just like how printing more money can cause inflation (reducing each dollar’s value if more dollars chase the same goods), creating new crypto tokens can dilute the value of existing tokens if demand doesn’t grow accordingly. Not all cryptos have inflation – some have a fixed supply (like Bitcoin’s 21 million cap, after which no new BTC are created). Others, however, continuously issue new tokens as part of their design. It’s crucial to understand a coin’s inflation rate, because it affects price over the long term.
Example of Low Token Inflation
For example, Dogecoin has an inflationary supply model: about 5 billion new DOGE are mined each year. In the early days, that was a huge increase relative to Dogecoin’s supply, but now with ~150 billion DOGE existing, 5 billion is around a 3.33% annual increase. Still, this infinite supply means Dogecoin will never be truly scarce – there will always be more coming.
If the community of users and buyers doesn’t grow at the same pace as supply, the price per DOGE will face downward pressure (because more coins are available without an increase in demand).
Example of Almost Zero Token Inflation
In contrast, Bitcoin’s inflation rate has become very low (~1% or less in 2025) and will drop to zero by 2140, which is why Bitcoin is often likened to “digital gold” – its scarcity increases over time. Bitcoin’s controlled, slowing inflation (via the halving events every four years) means it’s harder for supply growth to outpace demand growth, which has historically helped its price rise as adoption increases.
Example of An Extremely High Token Inflation
Some newer tokens, like Worldcoin, start with a small circulating supply and inflate significantly as tokens unlock or are distributed to users. Worldcoin’s circulating supply could increase from 1.7B to 10B over time (nearly a 6× increase) – that’s a high inflation scenario if it happens quickly. Unless the project’s growth and usage explode to create equal demand for those new tokens, basic economics says the price per token would likely fall to balance out the supply/demand.
Questions You Must Ask About To Avoid High Inflation
Always ask: How does this coin introduce new supply? Is it via mining rewards, staking rewards, team vesting, airdrops, or something else? And at what rate? A steady, modest inflation (like 2-3% a year) might be manageable if the community is also growing. But very high inflation (or big token unlock events) can be dangerous for investors, because you could be holding a token that’s constantly diluted.
On the flip side, if a project ever deflates (some coins implement token burns to reduce supply), that reduction in supply can help support or raise the price, assuming demand stays the same.
Supply and Demand Affect Token Valuation
In summary, token inflation affects value: when supply grows faster than demand, prices tend to drop; when supply is capped or grows slowly (or even shrinks), an increase in demand can drive prices up more easily. As a teen investor, you should be aware of a coin’s inflation policy. It’s often listed on data sites or in the project’s whitepaper. If an influencer claims a coin’s price will skyrocket, check how the supply might also be skyrocketing – you might find their prediction ignores dilution.
Comparing Tokenomics: Bitcoin vs. Dogecoin vs. Worldcoin vs. ICP
It helps to see these metrics in action with real examples side by side. Let’s compare the tokenomics of Bitcoin (BTC), Dogecoin (DOGE), Worldcoin (WLD), and Internet Computer (ICP) – four very different cryptocurrencies.
Bitcoin Tokenomics
Bitcoin’s tokenomics snapshot from CoinMarketCap (July 2025). Bitcoin has one of the highest market caps and a fixed supply of 21 million, with about 19.88 million (almost all) already in circulation.
Bitcoin is the largest crypto and its numbers reflect that. As of this snapshot, BTC’s price was over $109,000, giving it a market cap of about $2.17 trillion – by far the biggest in crypto. Its fully diluted valuation (FDV) is only slightly higher at $2.30 trillion, because the max supply is 21M and nearly 20M are already out. Circulating supply was 19.88 million BTC, which is the same as the total current supply since Bitcoin’s remaining tokens (to reach 21M) will be mined over the next century. Max supply is fixed at 21,000,000 BTC. Bitcoin’s 24h volume was around $45 billion, which is huge in absolute terms but relatively modest as a percentage of its market cap (Volume/Mcap ~2%). This suggests that while Bitcoin is actively traded, a lot of Bitcoin value also just sits in wallets as an investment. Bitcoin’s tokenomics show extreme scarcity – over 94% of all BTC that will ever exist are already in circulation. Its inflation is very low (and keeps decreasing), which is one reason people often say Bitcoin’s value may hold or increase over time if demand grows. There’s no hidden supply that will suddenly flood the market, so investors can focus on demand drivers.
Dogecoin Tokenomics
Dogecoin’s tokenomics snapshot. Dogecoin has a large supply with no maximum limit – over 150 billion DOGE are in circulation, and this grows by 5 billion per year.
Dogecoin, a popular meme-coin, shows very different tokenomics. Its price in this snapshot was about $0.1739(17 cents), which might sound cheap, but with 150.02 billion DOGE circulating that translated to a market cap of ~$26.1 billion. Dogecoin’s fully diluted market cap is listed the same as the current because there’s technically an infinite max supply (CoinMarketCap shows “∞” for max supply). In practice, Dogecoin adds 5 billion new DOGE each year through mining rewards, so the supply continuously increases. This inflation means that in five years, the supply could be ~25 billion DOGE higher. For investors, that’s a dilution to be aware of – if demand and usage of DOGE don’t grow enough, the price could drift down over time due to more coins existing (all else equal). Dogecoin’s 24h trading volume was about $985 million, which is roughly 3.8% of its market cap. This indicates a decent daily liquidity and interest (often driven by social media hype or Elon Musk tweets). Dogecoin’s tokenomics profile: huge supply, no cap, moderate inflation, value driven largely by community sentiment rather than scarcity. It’s a fun coin, but the tokenomics show why a prediction like “Dogecoin to $10” is far-fetched – at $10 per coin, with 150B+ supply, Doge’s market cap would be over $1.5 trillion, making it one of the most valuable assets in the world (larger than Google or Amazon) for a meme currency. That’s highly unlikely without extraordinary changes.
Worldcoin Tokenomics
Worldcoin (WLD) tokenomics snapshot. Worldcoin has a limited total supply of 10 billion, but only a small fraction of that (about 1.7 billion) is circulating so far, which means a large amount of future supply could enter the market.
Worldcoin is a newer project (in 2025) and its tokenomics illustrate the importance of checking circulating vs total supply. WLD’s price here was about $0.8866, and with 1.71 billion WLD in circulation, its market capwas around $1.52 billion. However, the fully diluted valuation was much higher at $8.86 billion because total supply is 10 billion tokens. Notably, CoinMarketCap also lists an “Unlocked Market Cap” of $3.08 billionfor WLD – this suggests that while 1.71B are circulating, a larger amount (maybe ~3.5B) might be “unlocked” (not locked by the project) but still not all actively trading. In any case, only ~17% of WLD’s total supply is out in the public; the rest is likely held by the project, investors, or vesting contracts and will be released over time. This means WLD will experience significant token inflation as it approaches that 10B total supply. If you’re investing in WLD, you’d want to know its token release schedule – how fast will that 8.3 billion locked tokens come into circulation? Worldcoin’s 24h volume was around $124.6 million (roughly 8% of its market cap, indicating active trading interest, possibly due to it being new and speculative). The high Volume/Mcap and low circulating percentage imply that WLD’s price could be volatile. As an investor, you’d be cautious: WLD’s tokenomics mean it’s currently valued on a small portion of its supply – if influencers claim “WLD to $100!”, you should do the math: $100 × 10 billion tokens = $1 trillion market cap, which is enormous (about half of Bitcoin’s market cap). That scenario would require Worldcoin to be one of the most valuable crypto projects ever, which is not impossible in the far future but certainly not easy or likely in the short term.
Internet Computer (ICP) Tokenomics
Internet Computer (ICP) tokenomics snapshot. Internet Computer has its entire current supply in circulation (~535 million ICP), and no fixed max supply (it’s an inflationary token). An “Unlocked Market Cap” is shown, which is lower than the market cap, possibly indicating some portion of supply is effectively locked or staked.
Internet Computer is a blockchain network project with a fairly large supply and no cap. In this snapshot, ICP’s price was exactly $5.00, with a circulating and total supply of 535.23 million ICP. That made its market cap about $2.68 billion. The max supply is listed as ∞ (infinite), meaning ICP is designed to be inflationary – new ICP can be minted over time (for example, as rewards for network participants). Interestingly, the data shows an Unlocked Market Cap of $1.1 billion, which is lower than the current market cap. This could imply that a substantial portion of ICP, while technically circulating, is locked in staking (users have staked ICP in “neurons” for governance, making those tokens illiquid for a certain period). In other words, about 59% of ICP’s market cap might be considered not freely tradable, which is why the “unlocked” value is lower.
The fact that 59% of ICP might be considered not freely tradable is an important nuance in tokenomics: some coins might have a lot of their supply tied up in staking or vesting, which reduces effective supply on the market. ICP’s 24h volume (not shown in the screenshot above) was on the order of only tens of millions of dollars, which is a small Volume/Mcap ratio (roughly 1–2%). This suggests ICP wasn’t traded as heavily relative to its size, possibly due to many tokens being locked by holders. Overall, ICP’s tokenomics show moderate market cap, large current supply, ongoing inflation, and a case of significant staking. Investors in such a project should monitor the inflation rate (how much new ICP is released each year) and how staking unlocks might increase liquid supply.
Summary of the Various Tokenomics Examples
These four examples demonstrate how different cryptos can be:
· Bitcoin: Huge market cap, high price, fixed low supply (almost all issued) → implies scarcity and low inflation.
· Dogecoin: Large market cap but low price per coin, enormous circulating supply with no cap → implies high supply and continuous inflation, value driven by community hype more than scarcity.
· Worldcoin: Smaller market cap, moderate price, limited total supply but most tokens not yet circulating → implies potential heavy inflation as tokens unlock, need to watch FDV and release schedule.
· ICP: Mid-range market cap, low price, large supply fully circulating but no max cap → implies inflationary future, with many tokens locked in network participants’ hands (reducing effective circulation).
By comparing these, you can see how tokenomics metrics paint a picture of each coin’s situation. Always consider these factors together – a coin’s price and hype don’t tell the full story without understanding its supply, market cap, and inflation.
Why Unrealistic Price Predictions Don’t Add Up
On social media and YouTube, you’ll often hear influencers making bold predictions like “This coin will 100x!” or “XYZ token to $1000 soon – get in now!”. As a smart investor, you should approach these claims with healthy skepticism and do the math. Many wild price forecasts are mathematically impossible (or at least highly unrealistic) because they ignore market cap and supply.
Testing How Realistic Price Predictions Are
Whenever someone predicts a future price for a coin, ask: What market cap would that imply? If that implied market cap is larger than that of Bitcoin or the entire crypto market, the prediction is most likely nonsense. Let’s look at a couple of examples:
Pi Network (PI) was a hyped project where some people speculated it could be worth $100+ per coin. However, if Pi had, say, about 100 billion tokens (not an actual number, just hypothetical for illustration) and each were $100, that would be $10 trillion in value. In fact, one analysis noted that at $100 per coin, Pi’s market cap would be $10 trillion — more than Apple, Microsoft, and Bitcoin combined! For context, Bitcoin’s market cap at its peak (as of mid 2025, at the time of this writing) was around $2.3 trillion. Expecting a newer coin to reach about 4.35 times ($10T/$2.3 = 4.35) the value of Bitcoin and top global companies is beyond extreme.
XRP (Ripple) is another well-known case. Some enthusiasts at one point claimed XRP could hit $100 (although it is currently at $2.50 per token). XRP’s circulating supply is on the order of 59 billion at the time of this writing and as is shown in Exhibit 5. At $100 each, that’s $100 × 59,000,000,000 = $5.9 trillion market cap which is far beyond Bitcoin’s market size or about 2.3T (in July 2025) and would make XRP more valuable than almost any company on Earth. Such targets were deemed “absurd” by experts due to the market cap implications. It’s not that XRP isn’t a significant project – it is – but one must consider that money isn’t unlimited. For XRP to be $100, it would need an absolutely massive amount of money invested in it, far exceeding the entire crypto market’s value today.
Exhibit 5
Now apply this reasoning to any coin that influencers hype. Dogecoin to $100? That would mean $100 × 150 billion DOGE = $15 trillion. That’s roughly 7 times Bitcoin’s value in 2025 – for a meme coin! Worldcoin to $100? That’s $100 × 10 billion = $1 trillion, which would put Worldcoin in the top tier of all cryptocurrencies, despite being brand new. Could it happen eventually? Perhaps anything’s possible in theory, but such a scenario would likely require Worldcoin to be adopted by billions of people or have an economic ecosystem rivaling the largest tech companies. Nearly all coins “going to the moon” predictions ignore the market cap math. As a teen investor, remember: if a price prediction sounds too good to be true, calculate the implied market cap yourself. You’ll often find the number is ludicrously high, showing the prediction has no realistic basis.
Why Market Cap (Not Price of Tokens) Matters
Also, be aware of unit bias – people tend to think a coin under $1 is cheap and can easily go to $10 or $100. But if that coin has, say, 1 trillion units, $10 each would require $10 trillion in value. It might be “cheap” per unit, but the project is not cheap when you look at market cap. Always compare market caps, not just prices. This will help you avoid being misled by YouTube thumbnails and tweets shouting astronomical targets.
Conclusion
Understanding tokenomics fundamentals – market cap, supply, FDV, volume, and inflation – will give you a solid toolkit to evaluate cryptocurrencies. Rather than getting caught up in hype, you can look at the data: How scarce is this token? How much are people trading it? How big can it realistically get? This knowledge will empower you as a young investor. Remember that in crypto (as in any market), value comes from supply and demand. By knowing the supply side of the equation and observing real demand (through market cap and volume), you’ll be far better equipped to spot red flags, like a coin that’s priced high only because of a tiny circulating supply, or an influencer pump that ignores basic math.
Before you invest in any coin, take a minute to check its market cap and supply figures on a site like CoinMarketCap or CoinGecko. If something has a huge FDV or an inflationary supply, know what you’re getting into. With these concepts, you can cut through the noise on social media. Cryptocurrencies aren’t magical money machines – they follow the same economic principles of supply and demand. By learning these principles now, you’re setting yourself up to be a savvy investor, able to make informed decisions rather than gambling on hype. Happy investing, and always stay curious and critical about the numbers behind the coins!